

By Yao Tang - Client Solutions
Benchmarking compensation in professional services is rarely a simple plug-and-play exercise. The data that firms submit is inherently varied, and without careful mapping, salary benchmarks quickly lose their value.
At Vencon Research, we devote a great deal of effort during the survey process to understanding the context, internal terminology and policy structures of every participating firm. Our priority is not only to collect numbers, but to normalise them, so that every data point in our reports represents a true like-for-like comparison.
Why hands-on mapping matters: the example of target bonus
Target bonus appears to be a straightforward field, yet there is no universal definition of it across the industry.

- Different meanings. For one firm, the target is the maximum bonus permitted under policy. For another, it is the typical payout for a mid-range performer.
- Different structures. Many firms have no formal target bonus at all. Bonuses are instead decided on a discretionary basis.
If a survey collects target figures without exploring these differences, the resulting market averages are distorted and misleading.
The same principle applies to job levels
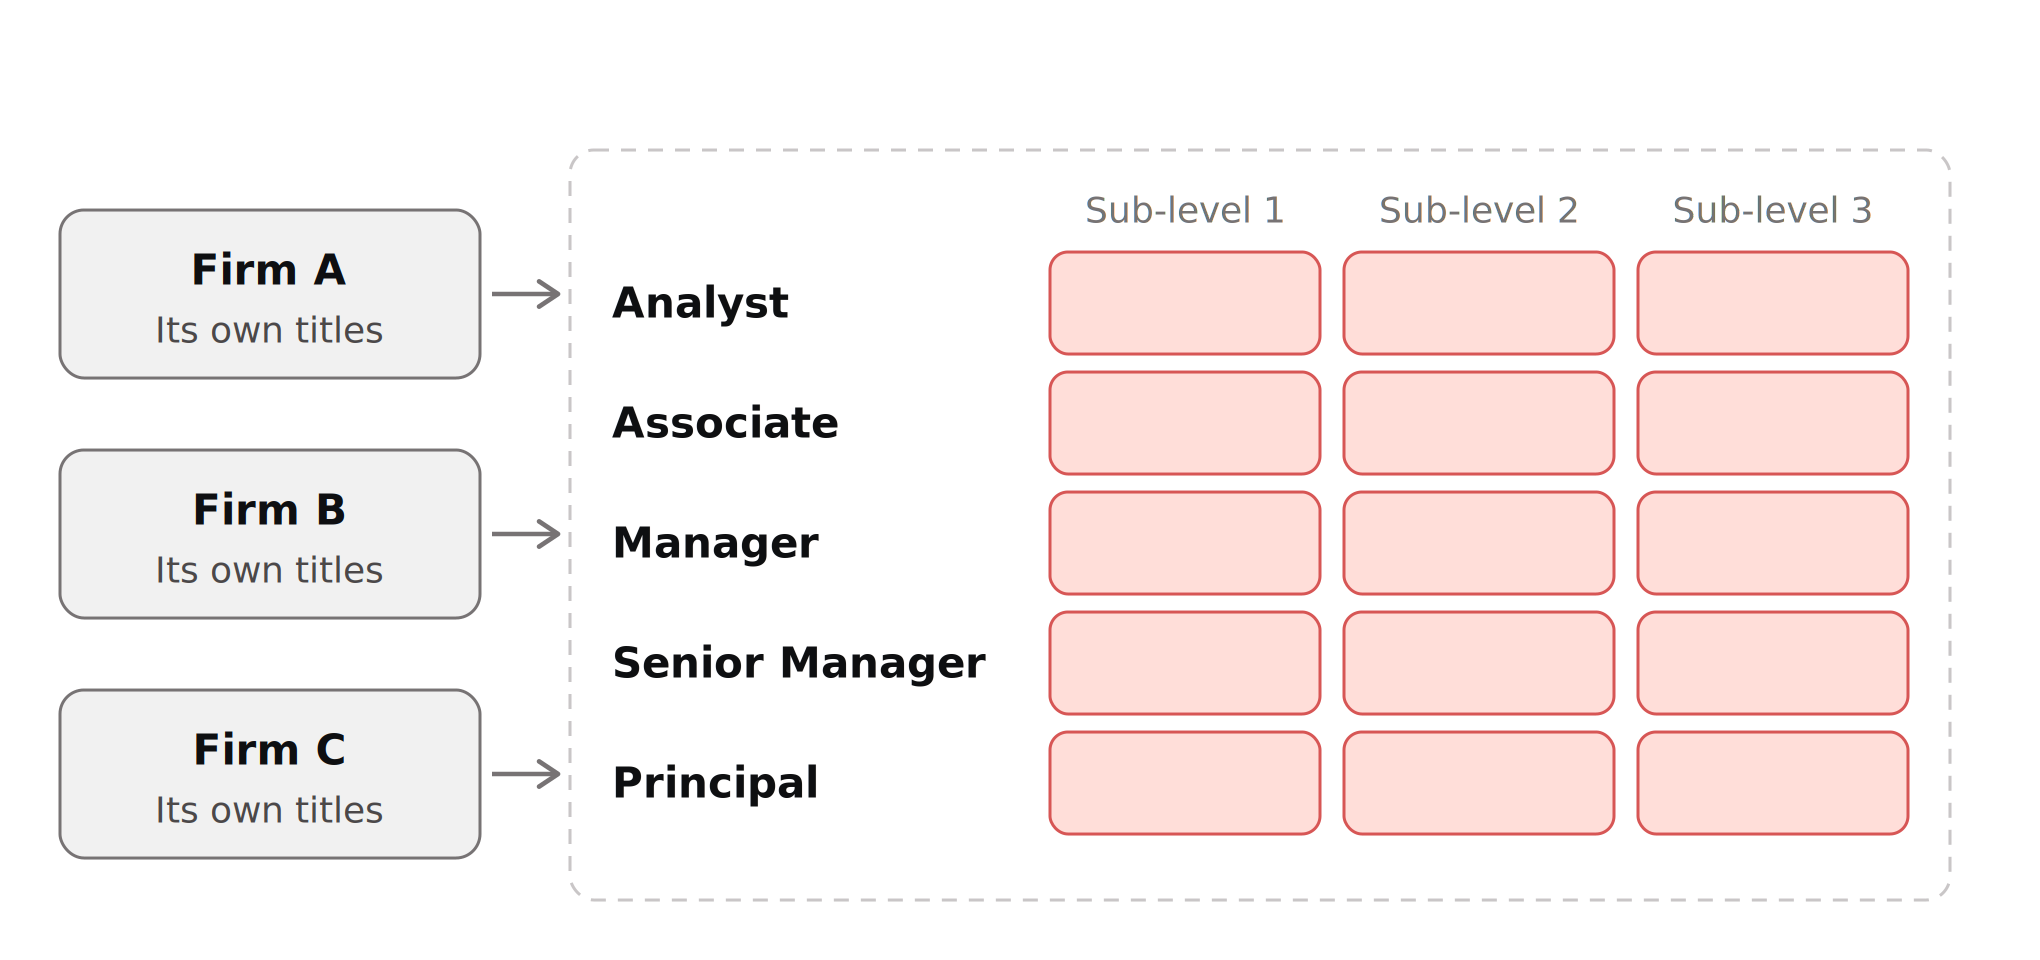
Firms use their own job titles and their own number of grades, so a title at one firm may sit at a different level at another. In our surveys, we map real-world roles onto five generic levels: Analyst, Associate, Manager, Senior Manager and Principal. Each level has three sub-levels, so that every role is compared with its true equivalent at other firms rather than matched by title alone.
How we ensure consistency
During data collection, we work directly with each participant to review its internal policies, definitions and scope. We apply this review to every element of the data, not only to the fields that are known to cause difficulty.

- Uniform criteria. We apply standardised Vencon definitions and mapping criteria across all participants, so that variations in internal naming or policy mechanics do not affect the dataset.
- Guidance on categorisation. We guide client teams on exactly how to categorise their data, reconciling the differences between discretionary pools, formulaic targets and realised payouts.
- Two perspectives. To give a complete factual picture, we capture both target expectations and actual realised cash, across two full sets of data covering the current year and the previous year.

Behind every reliable benchmark is a time-intensive mapping process. By doing this work, we aim to ensure that Total Rewards leaders can trust the data and make confident, defensible compensation decisions.
Have you ever encountered market data that did not feel like a true like-for-like comparison? We would be interested to hear how your team approaches these differences, and how you translate broad market trends into your local compensation structures. Get in touch here.
Vencon Research provides compensation benchmarking for consulting firms across 75+ country markets, covering AI-related and other specialist consulting skills. Contact us to learn more about our compensation surveys and benchmarking data.